Facilities Management Statistics 2026 (UK)
The key UK facilities management statistics in one place: market size, maintenance backlogs, fire and water-hygiene compliance, and the state of building documentation. Every figure links to its primary source — government statistics, regulators, or industry bodies — with the reference period stated. No vendor estimates, no unsourced numbers.
The headline statistic
£49 billion+
The maintenance backlog across UK public services is at least £49 billion.
The National Audit Office estimated in January 2025 that maintenance backlogs across schools, hospitals, prisons and other public buildings total at least £49 billion — and warned the true figure is likely higher because the government's condition data is incomplete.
Source: Maintaining public service facilities, 22 January 2025 · Link to this stat
UK FM market size and spend
How big facilities management is in the UK — the sector's contribution to the economy and the workforce behind it.
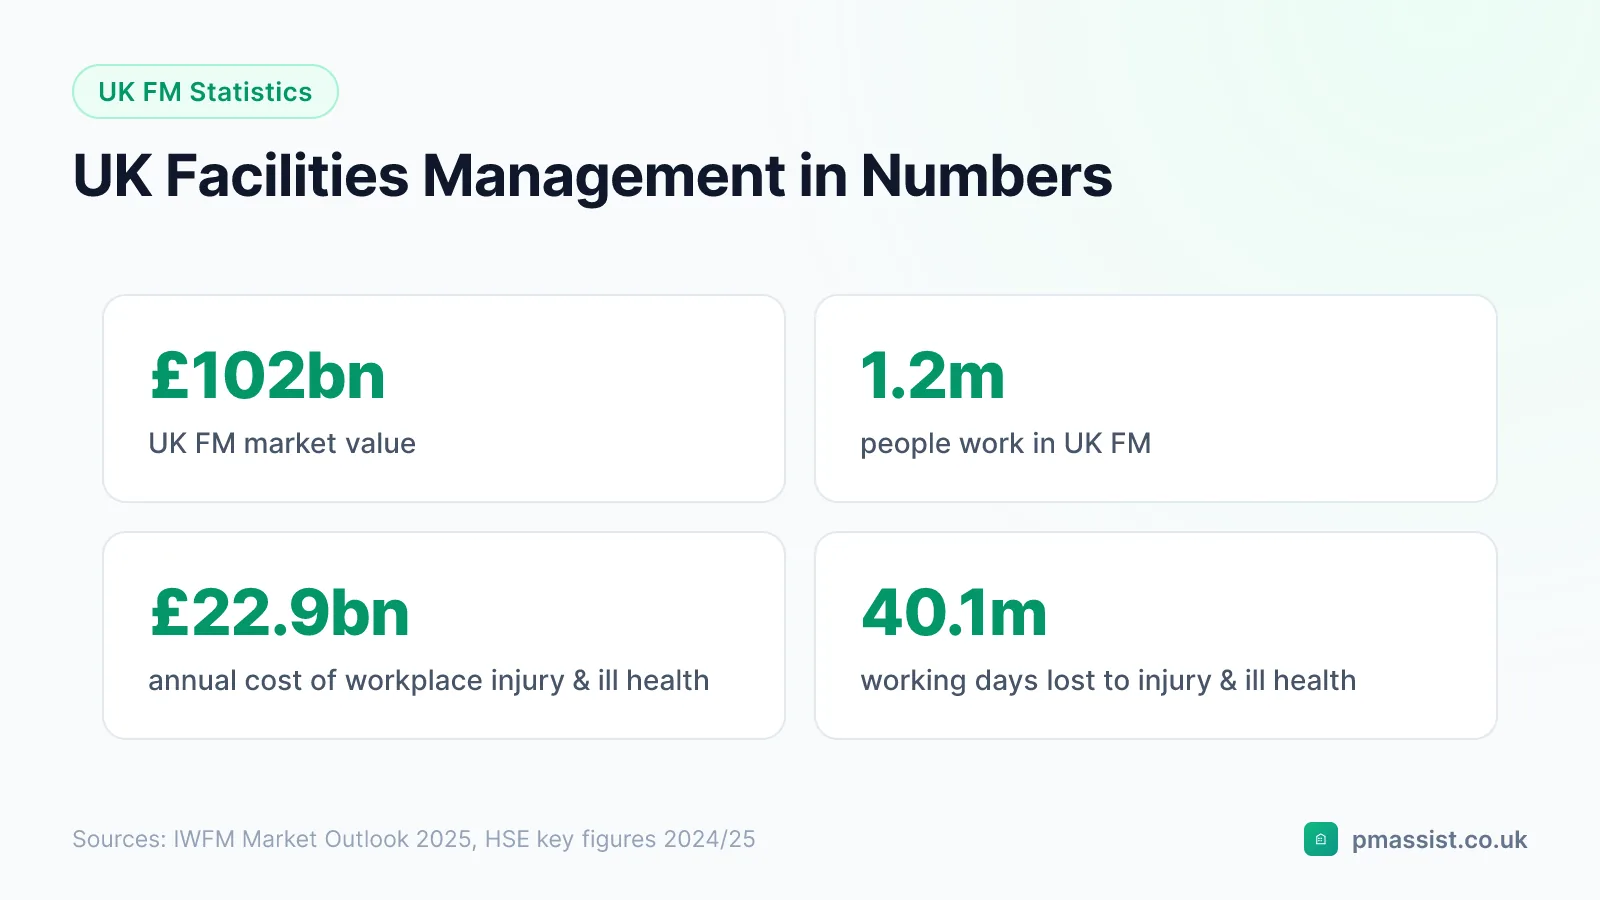
The UK workplace and facilities management sector is worth £102 billion to the economy.
The Institute of Workplace and Facilities Management puts the sector's contribution to the UK economy at £102 billion in its 2025 Market Outlook — making FM one of the country's largest service industries.
Around 1.2 million people work in UK facilities management.
IWFM's 2025 Market Outlook counts 1.2 million jobs in the UK workplace and facilities management sector — roughly one in every twenty-eight UK workers.
UK combined facilities management enterprises turned over £25.1 billion in 2024.
ONS puts the turnover of UK enterprises classified to SIC 2007 class 81100, Combined facilities management, at £25.08 billion at March 2024 — up 64.3% on the £15.26 billion recorded at March 2015. This is the measured FM supply industry: it counts firms selling bundled FM, and excludes standalone cleaning, security and catering contracts and every in-house FM team, which is why it sits well below IWFM's whole-sector estimate. ONS advises that turnover here comes from sources it is unable to verify.
235,916 people are employed by UK combined facilities management enterprises.
ONS business register data records 235,916 employees across UK enterprises classified to SIC 81100 at March 2024, up 44.9% from 162,765 at March 2015. This counts people employed by FM providers only — in-house FM staff are counted under their employer's own industry, so the number of people doing FM work in the UK is considerably higher.
4,210 UK enterprises are classified as combined facilities management providers.
The count of VAT- and/or PAYE-registered UK enterprises in SIC 81100 rose 60.1% between March 2015 and March 2024, from 2,630 to 4,210 — faster than either employment or turnover, so the average provider got smaller over the period. ONS control-rounds these counts to base five.
There are 2.13 million rateable non-domestic properties in England and Wales.
The Valuation Office Agency counted 2.13 million non-domestic properties on the rating lists at 31 March 2025 — 2.0 million in England and 126,000 in Wales. Every one of them is a building someone has to maintain, insure and keep compliant.
Source: Non-domestic rating: stock of properties, England and Wales, 2025
England and Wales have 1.75 million non-domestic buildings totalling around 620 million m² of floor space.
The government's Non-Domestic National Energy Efficiency Data-Framework (ND-NEED, 2025 edition) counts 1.75 million non-domestic buildings in England and Wales with a combined floor area of roughly 620 million square metres — the estate that UK facilities management exists to run.
Source: Non-domestic National Energy Efficiency Data-Framework (ND-NEED), 2025
The draft 2026 rating list values England and Wales' non-domestic properties at £84.4 billion in rateable value.
The VOA's draft list for the 2026 business rates revaluation puts total rateable value at £84.4 billion, up from £70.8 billion on the 2023 list — a 19% rise in the assessed rental value of the commercial building stock.
Source: Non-domestic rating: Reval 2026 draft list statistical commentary, November 2025
Running the NHS estate cost £14.0 billion in 2024/25.
NHS England's Estates Returns Information Collection puts the total cost of running the NHS estate at £14.0 billion for 2024/25 — the operating budget of what is effectively the UK's largest single facilities management undertaking.
Source: Estates Returns Information Collection (ERIC) 2024/25, published October 2025
The NHS estate spans 30.2 million square metres of floor space.
ERIC 2024/25 records a gross internal floor area of 30.2 million m² across the NHS estate, up 0.8% year on year as new hospitals and community clinics came online.
Source: Estates Returns Information Collection (ERIC) 2024/25, published October 2025
Cleaning the NHS estate alone costs £1.6 billion a year.
Within the NHS's £14.0 billion estate running costs for 2024/25, cleaning services accounted for £1.6 billion — a reminder that 'soft FM' line items reach the same order of magnitude as maintenance budgets.
Source: Estates Returns Information Collection (ERIC) 2024/25, published October 2025
UK construction output grew for the fifth consecutive year in 2025.
ONS reports annual construction output in Great Britain rose 1.8% in 2025 compared with 2024 — the fifth consecutive year of annual growth, sustaining demand for the maintenance and refurbishment work FM teams commission.
Source: Construction output in Great Britain: December 2025 and Q4 2025
The £102bn above is a whole-sector estimate. For the part of the sector ONS counts directly — bundled FM providers, their turnover, headcount and enterprise count — see our analysis of the UK facilities management market size, which explains why the two figures differ by so much.
Maintenance backlogs and the cost of deferred work
What under-maintained buildings cost the UK. The public-sector figures below are the best officially audited proxy for the price of deferred maintenance.
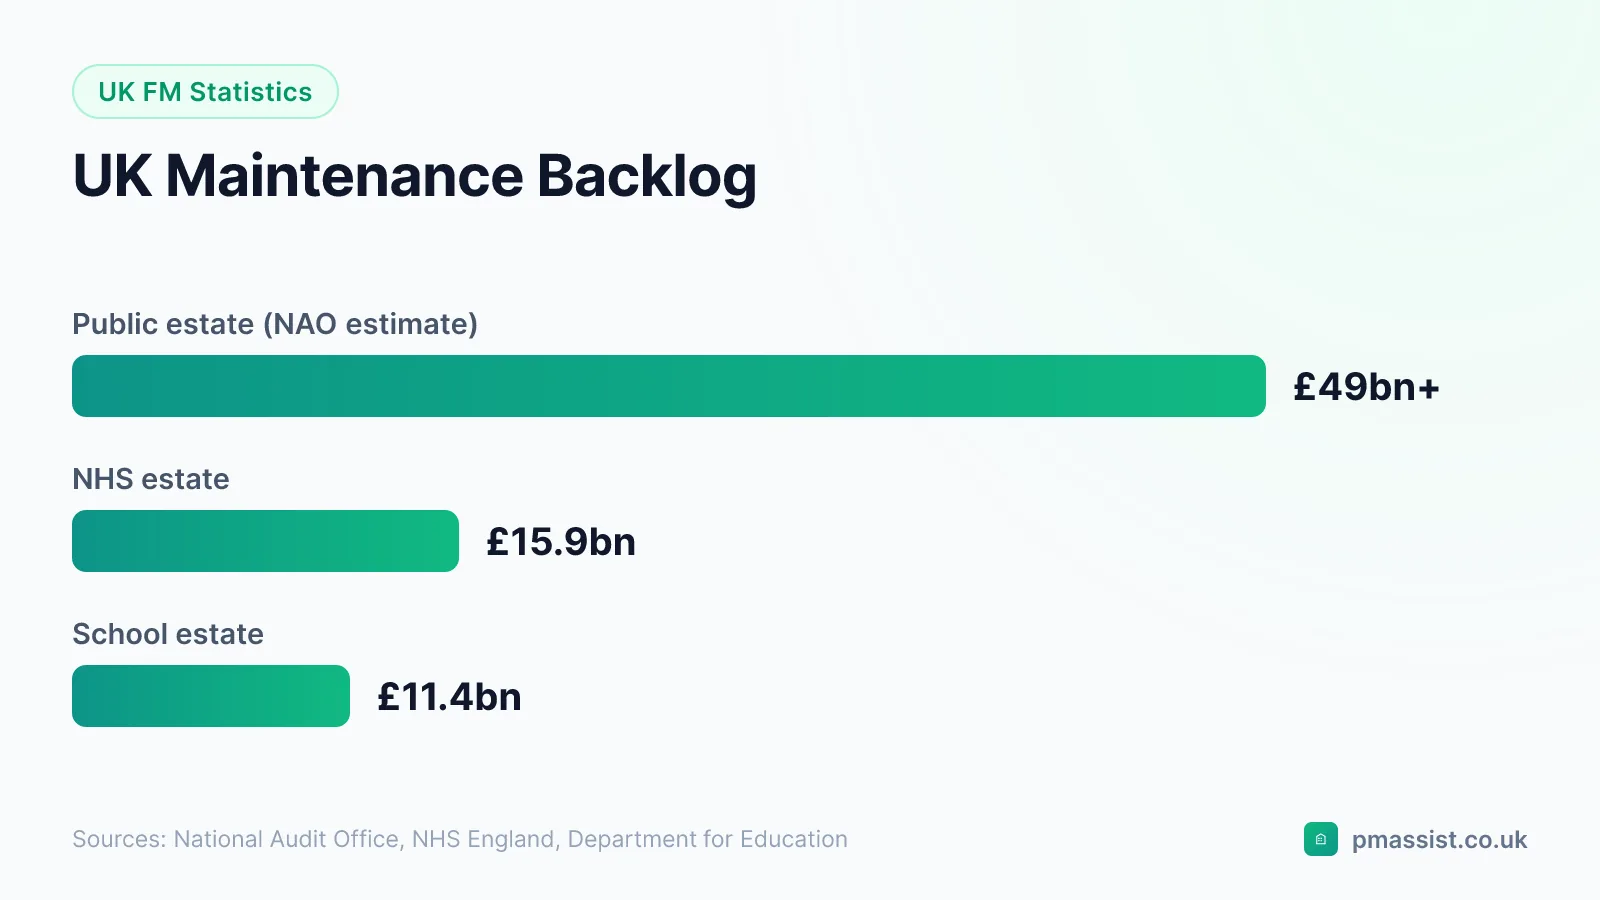
The maintenance backlog across UK public services is at least £49 billion.
The National Audit Office estimated in January 2025 that maintenance backlogs across schools, hospitals, prisons and other public buildings total at least £49 billion — and warned the true figure is likely higher because the government's condition data is incomplete.
Source: Maintaining public service facilities, 22 January 2025
Clearing the NHS estate's backlog maintenance would cost £15.9 billion.
NHS Estates Returns Information Collection (ERIC) data for 2024/25 puts the cost to eradicate backlog maintenance at £15.9 billion — up 15.7% on the £13.8 billion reported for 2023/24, with £5.6 billion of the work classed as significant risk.
Source: Estates Returns Information Collection (ERIC) 2024/25, published October 2025
Property and infrastructure failures cause around 5,400 NHS clinical service incidents every year.
The National Audit Office found that, on average between 2019/20 and 2023/24, approximately 5,400 clinical service incidents occurred in the NHS each year due to property and infrastructure failures — deferred maintenance measured in disrupted patient care, not just pounds.
Source: Maintaining public service facilities, 22 January 2025
Repairing every defective element of England's school estate would cost £11.4 billion.
The Department for Education's Condition Data Collection — a survey of 22,031 schools — estimated the total cost of repairing or replacing all defective building elements in the English school estate at £11.4 billion.
Source: Condition of School Buildings Survey (CDC1) key findings, May 2021
234 schools and colleges in England have confirmed RAAC in their buildings.
The Department for Education confirmed reinforced autoclaved aerated concrete (RAAC) in 234 education settings in February 2024 — 119 are having buildings rebuilt or refurbished under the School Rebuilding Programme, and 110 received grant funding to remove it.
Source: Plans to permanently remove RAAC from schools and colleges, 8 February 2024
The Ministry of Defence has the largest maintenance backlog of any government department: £15.3 billion.
Within the National Audit Office's £49 billion public-sector total, the MoD's estate carries the single biggest maintenance backlog at an estimated £15.3 billion — ahead of schools and the NHS at £13.8 billion each.
Source: Maintaining public service facilities — press release, 22 January 2025
Defence, schools and the NHS account for 88% of the government's £49 billion maintenance backlog.
The NAO found that MoD properties (£15.3 billion), schools (£13.8 billion) and NHS properties (£13.8 billion) each carry a backlog above £10 billion and together make up 88% of the public-sector total — the remainder sits mainly with prisons, courts and jobcentres.
Source: Maintaining public service facilities — press release, 22 January 2025
The NHS's high-risk maintenance backlog jumped 28% in a year, to £3.5 billion.
ERIC 2024/25 classes £3.5 billion of the NHS backlog as high risk — repairs needed urgently to prevent catastrophic failure or major disruption to clinical services — up 28% on the previous year, growing faster than the backlog overall.
Source: Estates Returns Information Collection (ERIC) 2024/25, published October 2025
The NHS backlog above is a single national number. We've broken it down per trust — normalised against the floor area each estate actually maintains — in our analysis of NHS maintenance backlog by trust, where the spread turns out to be an order of magnitude.
Building compliance: fire, water hygiene and statutory checks
The statutory workload facing UK building owners and FM teams — the inspection clocks that never stop ticking, and what happens when compliance fails.
There were 472 confirmed legionellosis cases in England and Wales in 2024.
UKHSA's national surveillance recorded 472 confirmed legionellosis cases in residents of England and Wales in 2024, 51.6% of them community-acquired — the risk that ACoP L8 water-hygiene regimes in buildings exist to control.
Source: Legionellosis in residents of England and Wales: 2024, published November 2025
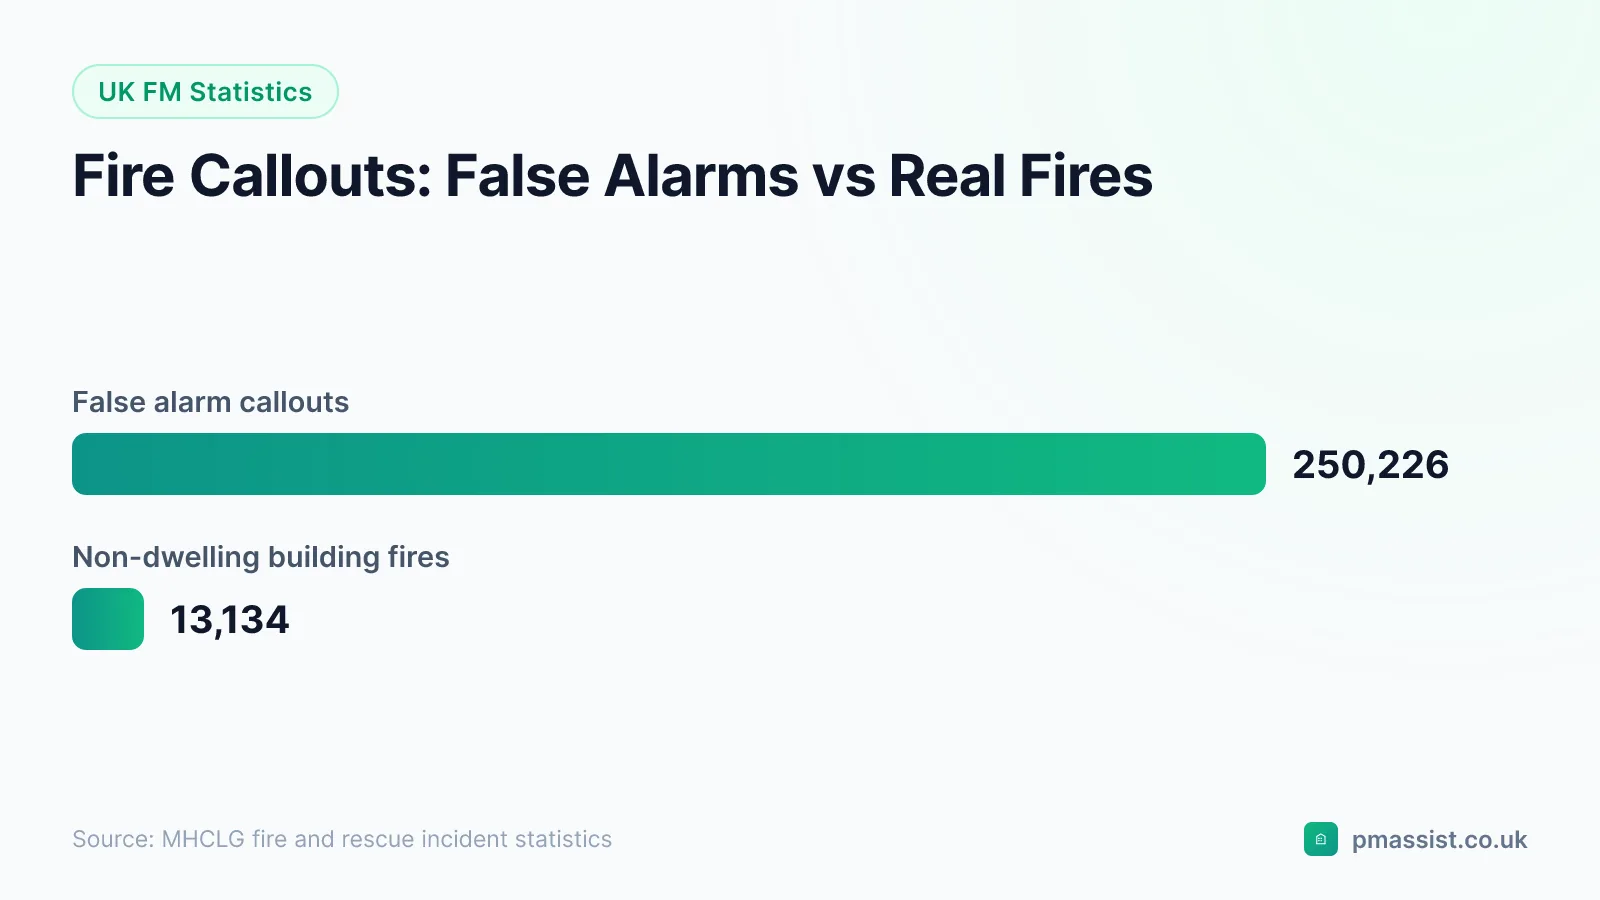
Fire services attended 13,134 fires in non-dwelling buildings in England in a single year.
In the year ending March 2025, fire and rescue services in England attended 13,134 fires in buildings other than dwellings — offices, schools, hospitals, industrial and retail premises — a 1.2% decrease on the previous year.
Source: Fire and rescue incident statistics, England, year ending March 2025
English fire services attended over 250,000 fire false alarms in a year — far more than actual fires.
Fire and rescue services in England attended 250,226 fire false alarms in the year ending March 2025 — up 16% on ten years earlier. Well-maintained detection systems, with accessible commissioning and maintenance records, are the first defence against unwanted alarms.
Source: Fire and rescue incident statistics, England, year ending March 2025
English fire and rescue services attended 142,494 fires in a single year.
Across all incident types, fire and rescue services in England attended 142,494 fires in the year ending March 2025 — a 2.5% rise on the previous year.
Source: Fire and rescue incident statistics, England, year ending March 2025
271 people died in fires in England in the year to March 2025 — one of the highest totals since 2017/18.
Fire-related fatalities in England reached 271 in the year ending March 2025, up 8% on the previous year and 12% on five years earlier — the human stake behind fire-safety maintenance regimes.
Source: Fire and rescue incident statistics, England, year ending March 2025
Around 12,500 higher-risk residential buildings in England fall under the Building Safety Regulator's new regime.
An estimated 12,500 occupied higher-risk buildings — residential buildings at least 18 metres or seven storeys tall — had to be registered with the Building Safety Regulator, each requiring a safety case and a golden thread of building information under the Building Safety Act 2022.
Source: The Building Safety Regulator: building a better regulator (report), 2024
BSR refused 66% of the building assessment certificate applications it determined in 2026.
The Building Safety Regulator reported on 9 July 2026 that 66% of building assessment certificate applications determined so far that year had been refused, and that assessments were taking twice as long as expected. The certificate is the point at which a higher-risk building's safety case report is tested, and BSR is responding with a more proportionate, risk-based approach. BSR has not published a breakdown of refusal reasons.
Nearly 2,000 buildings have been directed to apply for a building assessment certificate.
Since the process opened in April 2024, BSR has directed Principal Accountable Persons to apply for a building assessment certificate for nearly 2,000 higher-risk buildings, working through those with the most significant risks first. The first certificate was issued in January 2025, and BSR advises an assessment usually takes a minimum of six months.
4,411 residential buildings over 11 metres have been identified with unsafe cladding — and only 38% have completed remediation.
MHCLG's building safety remediation data for May 2026 tracks 4,411 residential buildings of 11 metres and over with unsafe cladding. 1,672 (38%) had completed remediation and 53% had at least started — nine years after Grenfell, most of the identified buildings are still not fully fixed.
Source: Building safety remediation: monthly data release, May 2026
Communal fire doors in buildings over 11 metres must be checked at least every 3 months by law.
Under the Fire Safety (England) Regulations 2022, responsible persons in residential buildings over 11 metres must check communal fire doors at least quarterly and flat entrance doors at least annually — recurring statutory tasks that have to be scheduled, done and evidenced.
Source: Fire Safety (England) Regulations 2022: fire door guidance
Passenger lifts must be thoroughly examined at least every 6 months under LOLER.
Regulation 9 of the Lifting Operations and Lifting Equipment Regulations 1998 requires lifting equipment used for lifting persons to be thoroughly examined at least every six months (twelve months for equipment lifting loads only), unless an examination scheme specifies otherwise — with the reports kept available for inspection.
Source: Lifting Operations and Lifting Equipment Regulations 1998, regulation 9
Legionella control means storing hot water at 60°C and getting 50°C to every outlet within a minute.
HSE's legionella guidance for hot and cold water systems calls for hot water stored at least at 60°C, distributed so it reaches 50°C (55°C in healthcare) within one minute at outlets, and cold water kept below 20°C where possible — the temperature regime behind routine sentinel-outlet monitoring.
Source: Legionella and legionnaires' disease: hot and cold water systems
Electrical installations in English rented homes must be inspected and tested at least every 5 years.
The Electrical Safety Standards in the Private Rented Sector (England) Regulations 2020 require landlords to have the electrical installation inspected and tested by a qualified person at least every five years, and to hold the report (EICR) for the record.
Source: Electrical safety standards in the private rented sector: guidance for landlords
F-gas equipment with a charge of 5 tonnes CO₂e or more needs a leak check at least every 12 months.
UK F-gas rules require leak checks at least every 12 months for equipment containing 5 tonnes CO₂ equivalent or more of F-gas, every 6 months at 50 tonnes CO₂e, and every 3 months at 500 tonnes CO₂e — intervals that double when automatic leak detection is fitted. Charge sizes are calculated in CO₂e, which depends on each refrigerant's GWP.
Air conditioning systems over 12kW must have an energy inspection at least every 5 years.
The Energy Performance of Buildings (England and Wales) Regulations 2012 require air conditioning systems with an effective rated output over 12kW to be inspected by an accredited energy assessor at intervals not exceeding five years — the inspections commonly known as TM44 reports.
Source: Energy Performance of Buildings (England and Wales) Regulations 2012, regulation 18
For higher-risk buildings, the compliance clock starts before construction does. We track how long Building Safety Regulator approval actually takes in gateway 2 approval times, updated with each monthly release.
Workplace health and safety
What unsafe workplaces cost Great Britain in lives, health and money — the backdrop to every maintenance regime and permit to work.
Workplace injuries and ill health cost Great Britain £22.9 billion in a year.
HSE estimates the total cost of workplace self-reported injuries and new cases of work-related ill health at £22.9 billion for 2023/24 — ill health accounts for around 72% (£16.4 billion) and injuries around 28% (£6.5 billion).
Source: Costs to Great Britain of workplace injuries and new cases of work-related ill health, 2023/24
40.1 million working days were lost to work-related ill health and workplace injury in 2024/25.
HSE's key annual figures for Great Britain report 40.1 million working days lost due to work-related illness and workplace injury in 2024/25, with 1.9 million workers suffering from a work-related illness.
Source: HSE health and safety statistics, key figures for 2024/25
124 workers were killed in work-related incidents in 2024/25.
HSE's provisional figures record 124 workers killed in Great Britain in 2024/25. Construction accounted for the most deaths of any sector, while agriculture, forestry and fishing had the highest fatality rate per 100,000 workers.
Falls from height killed 35 workers in 2024/25 — still the leading cause of workplace death.
35 workers died following a fall from height in 2024/25, more than a quarter of all worker fatalities — which is why working-at-height controls, ladder inspections and roof-access procedures sit at the top of every FM safety regime.
Asbestos-related diseases still kill around 5,000 people a year in Great Britain.
HSE estimates around 5,000 deaths a year from asbestos-related diseases including mesothelioma, asbestos-related lung cancer and asbestosis — a legacy of past exposure that makes the asbestos register one of the most safety-critical documents in any pre-2000 building.
Source: Asbestos-related disease statistics, Great Britain 2025
There were 2,218 mesothelioma deaths in Great Britain in 2023.
Official mortality statistics record 2,218 mesothelioma deaths in 2023 — below the 2011–2020 annual average of around 2,500 as the epidemic slowly passes its peak, but still six people a day dying from a disease caused almost entirely by asbestos exposure.
Source: Mesothelioma and asbestosis mortality in Great Britain 1968 to 2024
A record 964,000 workers reported work-related stress, depression or anxiety in 2024/25.
HSE's 2024/25 statistics report 964,000 workers suffering from work-related stress, depression or anxiety — up around 180,000 on the previous year and now roughly half of all work-related ill health.
Source: HSE health and safety statistics, key figures for 2024/25
An estimated 680,000 workers sustained a non-fatal injury at work in 2024/25.
Self-reported data in HSE's key annual figures estimates 680,000 non-fatal workplace injuries in Great Britain in 2024/25 — slips, trips, handling and machinery incidents that planned maintenance and good housekeeping exist to prevent.
Source: HSE health and safety statistics, key figures for 2024/25
Health and safety offences drew over £33 million in fines in 2024/25, with a 96% conviction rate.
HSE's enforcement activity in 2024/25 produced more than £33 million in fines from 246 completed prosecutions at a 96% conviction rate, alongside over 4,400 enforcement notices — non-compliance is both likely to be caught and expensive when it is.
Energy, carbon and net zero
Buildings are the UK's second-largest source of emissions, and the regulatory net around building energy performance is tightening every year.
UK emissions have fallen 53% since 1990 — to 373 million tonnes CO₂e in 2024.
UK territorial greenhouse gas emissions were 373 MtCO₂e in 2024, down 3% on 2023 and 53% on 1990. Most of that fall came from decarbonising electricity; the harder remaining half includes the heat and fabric of the building stock.
Source: Final UK greenhouse gas emissions statistics, 1990 to 2024
Net zero by 2050 is a legal obligation, not a target — set in UK law since 2019.
The Climate Change Act 2008 (2050 Target Amendment) Order 2019 committed the UK in law to reducing net greenhouse gas emissions by 100% against 1990 levels by 2050 — a duty that flows down into building energy performance standards, heat decarbonisation and estate strategies.
Source: The Climate Change Act 2008 (2050 Target Amendment) Order 2019
It has been unlawful to continue letting a commercial property rated below EPC E since April 2023.
Under the Minimum Energy Efficiency Standard (MEES), landlords of non-domestic rented property in England and Wales have needed at least an EPC E to grant new leases since 2018 — and since 1 April 2023 the standard applies to continuing leases too, unless a valid exemption is registered.
Source: Non-domestic private rented property: minimum energy efficiency standard — landlord guidance
F-gas emissions from buildings and product uses have more than halved since 2012.
DESNZ's final emissions statistics show F-gas emissions in the buildings and product uses sector fell 53% between 2012 and 2024, as the HFC phase-down pushed refrigeration and air conditioning towards lower-GWP refrigerants — the transition F-gas registers and leak-check records document.
Source: Final UK greenhouse gas emissions statistics, 1990 to 2024
The NHS estate consumed 11.3 billion kWh of energy in 2024/25.
ERIC 2024/25 records energy consumption of 11.3 billion kWh across the NHS estate in a single year — a measure of what estate-scale energy management is up against, and of why the NHS runs one of the UK's largest building decarbonisation programmes.
Source: Estates Returns Information Collection (ERIC) 2024/25, published October 2025
Building information and documentation
Missing, fragmented building documentation is now a recognised national problem — and, since the Building Safety Act 2022, a legal one.
Fragmented building information is why the law now demands a “golden thread”.
Dame Judith Hackitt's Independent Review of Building Regulations and Fire Safety (May 2018) found that safety-critical building information was too often fragmented, incomplete or lost at handover, and recommended a digital “golden thread” of building information — now a statutory duty for higher-risk buildings under the Building Safety Act 2022.
Source: Building a Safer Future: final report (Hackitt Review), 17 May 2018
The government cannot cost its own maintenance backlog because its property data is incomplete and out of date.
The National Audit Office reported in January 2025 that the true cost of remediating public buildings is unknown — and probably well above £49 billion — because “the government's data on the condition of its properties is incomplete and out of date”. Poor building information doesn't just slow engineers down; it makes the problem impossible to measure.
Source: Maintaining public service facilities, 22 January 2025
Handing over fire safety information at building completion has been a legal duty since 2010.
Regulation 38 of the Building Regulations 2010 requires that fire safety information about a building's design and construction is given to the responsible person no later than completion — the legal baseline for the handover documentation FM teams inherit and must keep findable.
Central government has required BIM on its construction projects since 2016.
The Government Construction Strategy 2016–20 committed departments to embedding BIM Level 2 — collaborative, structured digital building information — across central government projects, pushing digital handover data down the whole supply chain.
Around four in five construction professionals have now adopted BIM.
NBS's Digital Construction Report 2023 found only about one in five of its 700+ surveyed construction professionals had yet to adopt BIM — meaning the buildings being handed over to FM teams increasingly arrive with structured digital information, if teams have somewhere to use it.
This is the problem PM Assist exists to solve. Most buildings already hold the answers — in O&M manuals, drawings, and commissioning records — but the information can't be reached when it's needed. Making that documentation searchable restores the golden thread for the buildings you already run — try it with our free O&M search demo.
Methodology & sources
Every statistic on this page was checked against the primary source listed below on the access date shown. We only include figures published by government departments, statutory bodies, auditors, or recognised industry institutes — no vendor surveys, press rehashes, or modelled estimates. Reference periods differ by source (each stat states its own), and figures are quoted as published, not adjusted. When a source releases new data we update the figure and the "last updated" date above.
- IWFM: IWFM Market Outlook Survey Report 2025 (accessed 17 July 2026)
- Office for National Statistics: Facilities management count, employment and turnover, 2015 and 2024 (ad hoc release 3013, 12 September 2025) (accessed 10 September 2026)
- Valuation Office Agency: Non-domestic rating: stock of properties, England and Wales, 2025 (accessed 23 July 2026)
- DESNZ: Non-domestic National Energy Efficiency Data-Framework (ND-NEED), 2025 (accessed 23 July 2026)
- Valuation Office Agency: Non-domestic rating: Reval 2026 draft list statistical commentary, November 2025 (accessed 23 July 2026)
- NHS England: Estates Returns Information Collection (ERIC) 2024/25, published October 2025 (accessed 23 July 2026)
- Office for National Statistics: Construction output in Great Britain: December 2025 and Q4 2025 (accessed 23 July 2026)
- National Audit Office: Maintaining public service facilities, 22 January 2025 (accessed 17 July 2026)
- Department for Education: Condition of School Buildings Survey (CDC1) key findings, May 2021 (accessed 17 July 2026)
- Department for Education: Plans to permanently remove RAAC from schools and colleges, 8 February 2024 (accessed 17 July 2026)
- National Audit Office: Maintaining public service facilities — press release, 22 January 2025 (accessed 23 July 2026)
- UK Health Security Agency: Legionellosis in residents of England and Wales: 2024, published November 2025 (accessed 17 July 2026)
- MHCLG: Fire and rescue incident statistics, England, year ending March 2025 (accessed 17 July 2026)
- House of Lords Industry and Regulators Committee: The Building Safety Regulator: building a better regulator (report), 2024 (accessed 23 July 2026)
- Building Safety Regulator: BSR to introduce more proportionate and targeted approach for higher-risk building assessments, 9 July 2026 (accessed 10 September 2026)
- MHCLG: Building safety remediation: monthly data release, May 2026 (accessed 23 July 2026)
- Home Office: Fire Safety (England) Regulations 2022: fire door guidance (accessed 23 July 2026)
- legislation.gov.uk: Lifting Operations and Lifting Equipment Regulations 1998, regulation 9 (accessed 23 July 2026)
- Health and Safety Executive: Legionella and legionnaires' disease: hot and cold water systems (accessed 23 July 2026)
- MHCLG: Electrical safety standards in the private rented sector: guidance for landlords (accessed 23 July 2026)
- Environment Agency / Defra: Checking F gas equipment for leaks (guidance) (accessed 23 July 2026)
- legislation.gov.uk: Energy Performance of Buildings (England and Wales) Regulations 2012, regulation 18 (accessed 23 July 2026)
- Health and Safety Executive: Costs to Great Britain of workplace injuries and new cases of work-related ill health, 2023/24 (accessed 17 July 2026)
- Health and Safety Executive: HSE health and safety statistics, key figures for 2024/25 (accessed 17 July 2026)
- Health and Safety Executive: Work-related fatal injury statistics 2024/25 (accessed 23 July 2026)
- Health and Safety Executive: Asbestos-related disease statistics, Great Britain 2025 (accessed 23 July 2026)
- HSE / Office for National Statistics: Mesothelioma and asbestosis mortality in Great Britain 1968 to 2024 (accessed 23 July 2026)
- Health and Safety Executive: HSE enforcement statistics 2024/25 (accessed 23 July 2026)
- DESNZ: Final UK greenhouse gas emissions statistics, 1990 to 2024 (accessed 23 July 2026)
- legislation.gov.uk: The Climate Change Act 2008 (2050 Target Amendment) Order 2019 (accessed 23 July 2026)
- DESNZ: Non-domestic private rented property: minimum energy efficiency standard — landlord guidance (accessed 23 July 2026)
- Independent Review of Building Regulations and Fire Safety: Building a Safer Future: final report (Hackitt Review), 17 May 2018 (accessed 17 July 2026)
- legislation.gov.uk: The Building Regulations 2010, regulation 38 (accessed 23 July 2026)
- Infrastructure and Projects Authority: Government Construction Strategy 2016–20 (accessed 23 July 2026)
- NBS: NBS Digital Construction Report 2023 (accessed 23 July 2026)
Citing these statistics? Please credit and link the original source. Each stat block on this page has a stable anchor link (the icon) if you want to reference our summary.
Put the numbers to work
The backlog and compliance figures above are the case for planned maintenance done properly. Our free, SFG20-aware equipment checklists cover the assets behind most of these statistics:
Or explore our free FM tools and building document guides.
Sector-specific context for these figures: healthcare & NHS estates, schools & universities, and commercial property.
Frequently asked questions
How big is the UK facilities management market?
How much does unplanned maintenance cost UK facilities?
What is the NHS maintenance backlog?
How many Legionnaires' disease cases are there in the UK each year?
What is the golden thread of building information?
Can I cite these statistics?
Stop your buildings becoming a statistic
The common thread in the numbers above is information: backlogs that can't be costed, compliance that can't be evidenced, documents that can't be found. PM Assist makes your O&M manuals, drawings, and certificates searchable in plain English — with source-cited answers.
- Upload and organise building documentation
- AI-powered search across all your manuals
- Source-cited answers for every query
- Team collaboration and access control
- No credit card required to start
Data, method and how to cite it
First published July 2026 · Figures last checked against the source on 13 September 2026
Download the data
- CSV: All statistics with their figure, source, source URL and access date.
How these figures were produced
Each statistic is taken directly from a named official publication rather than from secondary reporting, and carries the publisher, the publication title and date, a direct link, and the date we last confirmed the figure against that source. Nothing is estimated, interpolated or carried over from a previous edition: a figure whose source cannot be reached is removed rather than left standing.
- Source data
- Multiple UK government and regulatory bodies — Compiled from National Audit Office, ONS, HSE, NHS England, MHCLG, DESNZ, Building Safety Regulator and other official releases; each statistic carries its own source and access date.. View the source
- Licence
- Open Government Licence v3.0
Cite this data
Free to use with attribution. The analysis is ours; the underlying data is Multiple UK government and regulatory bodies's, so please credit both.
Suggested citation
PM Assist (2026) "UK facilities management statistics". Derived from Multiple UK government and regulatory bodies, Compiled from National Audit Office, ONS, HSE, NHS England, MHCLG, DESNZ, Building Safety Regulator and other official releases; each statistic carries its own source and access date.. Available at: https://pmassist.co.uk/facilities-management-statistics (accessed 13 September 2026).
Link snippet
<a href="https://pmassist.co.uk/facilities-management-statistics">UK facilities management statistics</a> — PM Assist, derived from Multiple UK government and regulatory bodies dataSpotted something that looks wrong? Tell us — a figure we cannot trace back to its source gets removed, not defended.